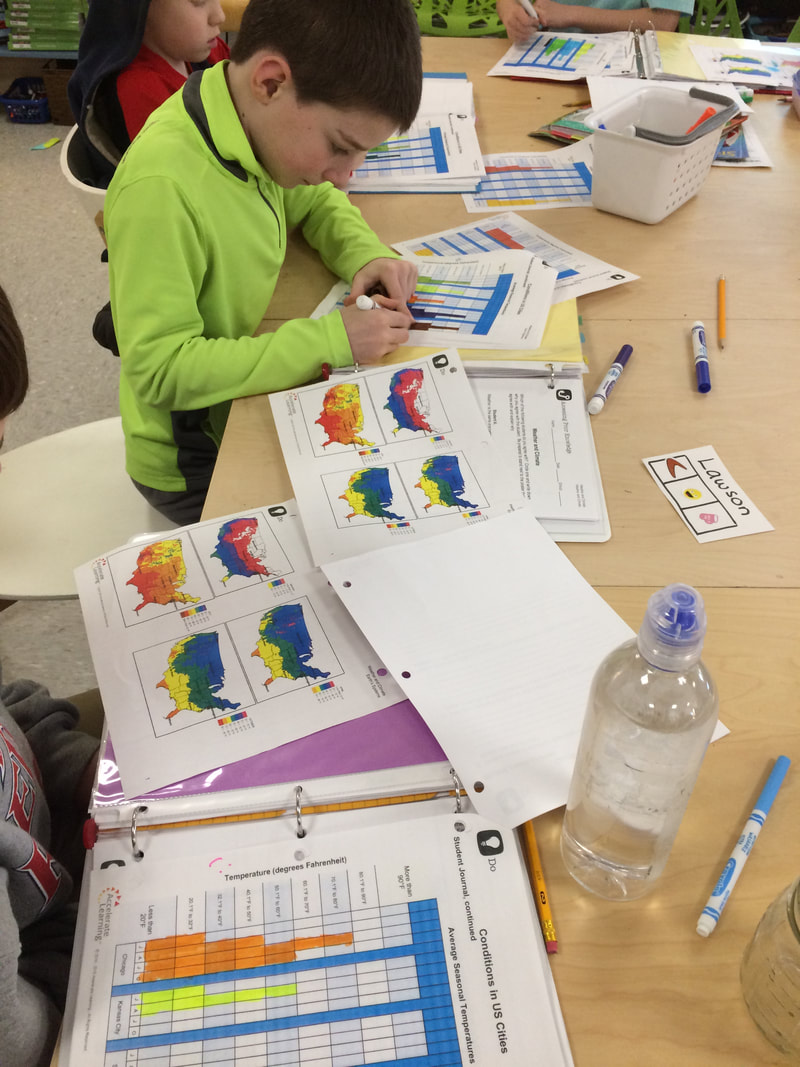
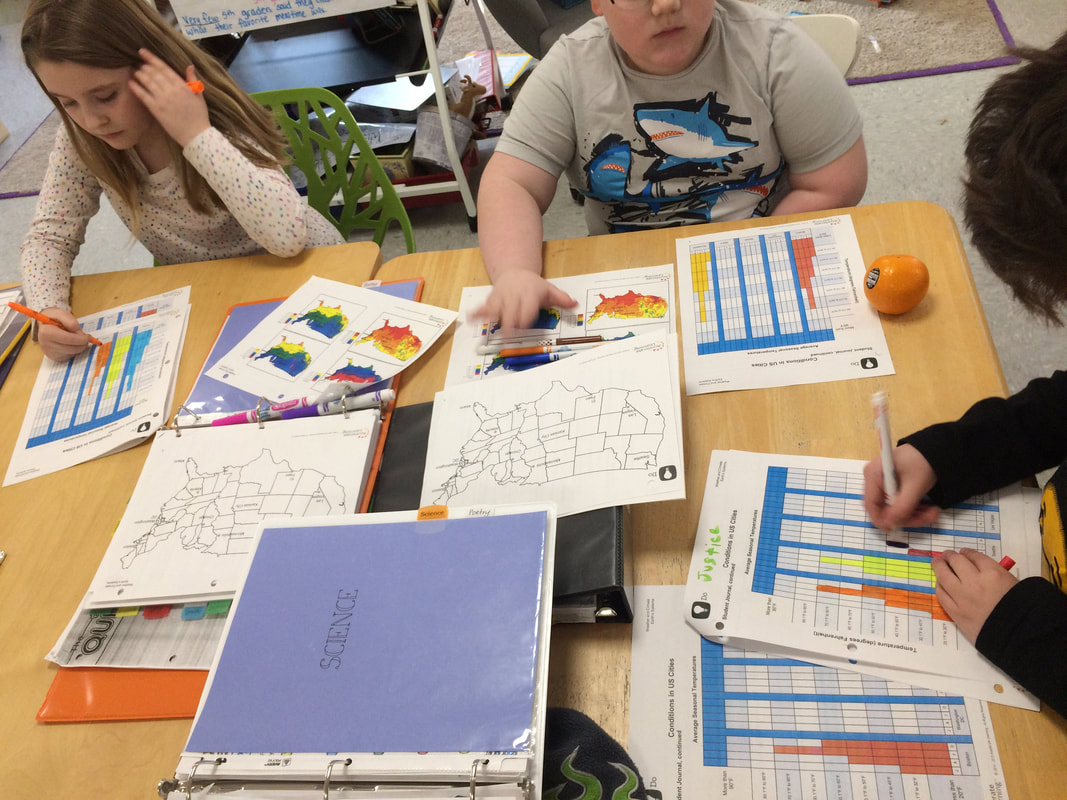
Students are graphing annual temperatures, snowfall, and rainfall in 10 major US cities. They are then tasked with the objective of describing or comparing and contrasting the climates in those cities.
|
About this pageA place to find updates on classroom, school, or local happenings! Archives
October 2018
Categories |
 RSS Feed
